E-COMMERCE CAMPAIGN
- Industry
- E-Commerce / Food & Beverage
- Project Type
- SEO & Organic Growth Campaign
- Duration
- Feb 2025 – Apr 2026 reporting
- My Role
- Project Management, Client Strategy & Reporting
A premium imported juice brand selling direct-to-consumer in the US. The campaign combined technical SEO, local visibility and a weekly content engine — and the numbers moved.
The Context
so, what was actually going on?
An e-commerce brand with a strong product and a website that wasn't pulling its weight in search. The reporting baseline (Feb 20 – Sep 24, 2025) was compared against the campaign period (Sep 25, 2025 – Apr 29, 2026) in GA4.
The Challenge
what needed solving?
Grow traffic, new audience acquisition and engagement quality at the same time — more visitors, but also better visitors.
The Objective
what were we trying to change?
Increase organic visibility and keyword rankings, grow users and sessions, and improve how people actually behaved on the site.
The Approach
okay. what do we do about it?
Three tracks running in parallel: Google Business Profile optimization with consistent posting (from Feb 2026), continuous technical SEO using SEMrush, Screaming Frog and Google Search Console, and a structured blog calendar publishing SEO-optimised content weekly.
- Google Business Profile optimization and consistent posting cadence
- Ongoing technical SEO: crawlability, indexing, error resolution
- Structured blog calendar built around search intent, published weekly
- Keyword tracking and ranking movement reviewed month over month
My Contribution
what did i actually own?
I managed the campaign on the agency side: client communication and expectation-setting, coordinating the SEO, content and development work, analysing performance in GA4, and turning the numbers into monthly reporting the client could actually use.
The Results
and then the numbers started talking.
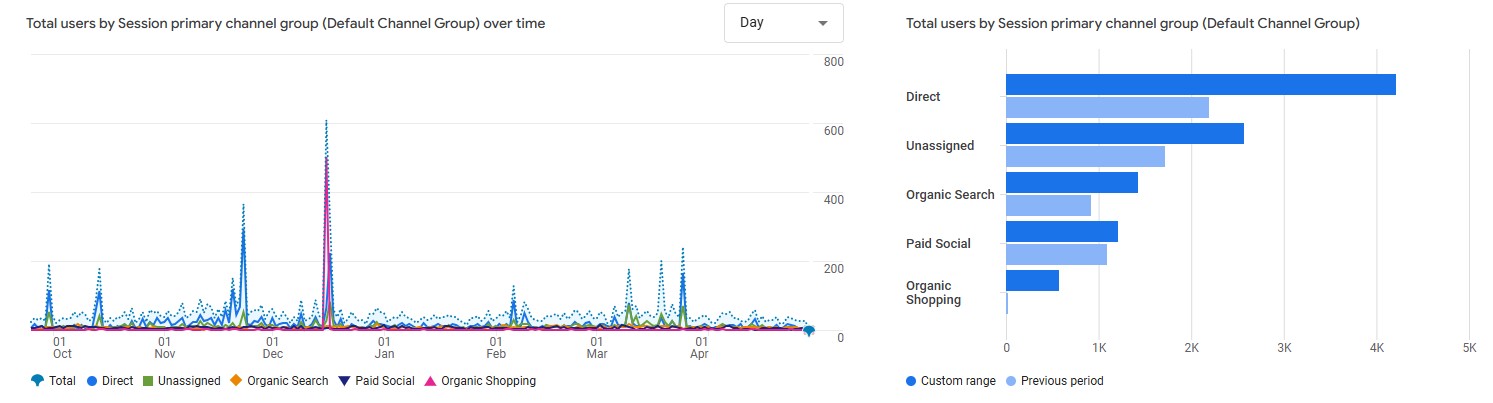
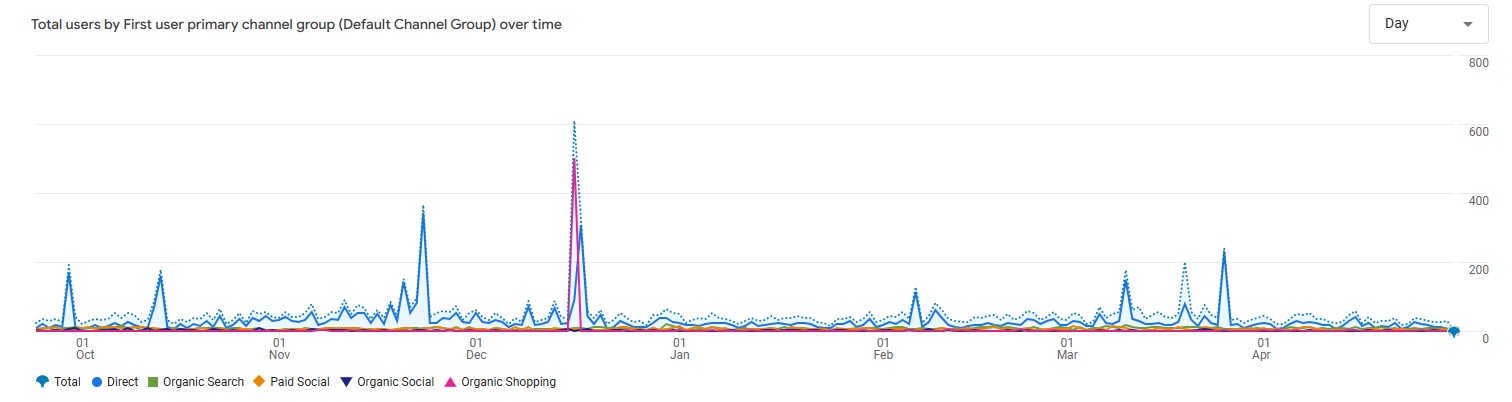
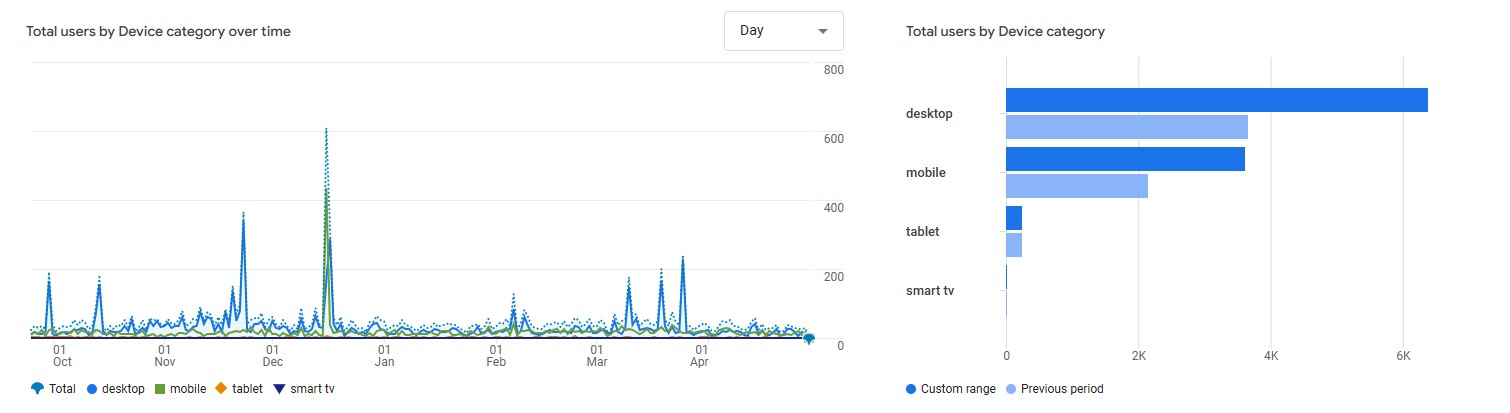
6,053 → 10,241
Total Users
Feb–Sep 2025 vs Sep 2025–Apr 2026 · GA4
4,304 → 7,829
New Users
Campaign report comparison
7,555 → 11,534
Sessions
Campaign report comparison
10,467 → 17,916
Page Views
Campaign report comparison
1.39 → 1.55
Pages / Session
Campaign report comparison
33.95% → 22%
Bounce Rate
Campaign report comparison
921 → 1,423
Organic Search
Campaign report comparison
0 → 19
Keywords on Google Page 1
25 keywords in Google Top 100
- Total users increased from 6,053 to 10,241
- New users increased from 4,304 to 7,829
- Sessions grew from 7,555 to 11,534
- Page views increased from 10,467 to 17,916
- Pages per session improved from 1.39 to 1.55
- Bounce rate improved from 33.95% to 22%
- Organic Search grew from 921 to 1,423
- 19 keywords reached Google's first page; 25 keywords in the Top 100
Results reflect the full campaign team's work across the reporting period. Figures are from the client's campaign timeline report (GA4).
07 — The Evidence the receipts, pinned.
Learnings
so, what did we learn?
Rankings are a lagging indicator. The leading ones were boring: technical hygiene, a content calendar that actually shipped, and reporting that kept everyone honest.